Open the monitoring tab
- Direct your web browser to https://app.spotlightcloud.io.
- Sign in using your Quest account.
- Ensure the Monitoring tab is to the front.
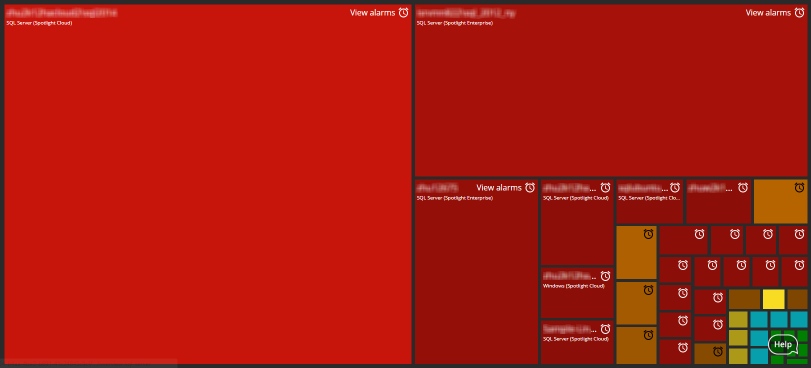
Heatmap page
The initial Spotlight Cloud monitoring page is the heatmap. The heatmap answers the question: Which monitored connections require the most urgent attention? See heatmap.
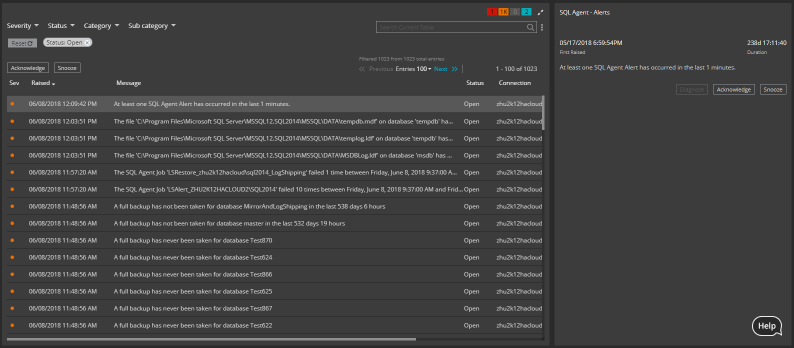
Alarms page
Use the alarms page to comprehensively inquire into outstanding alarms. See the alarms page.
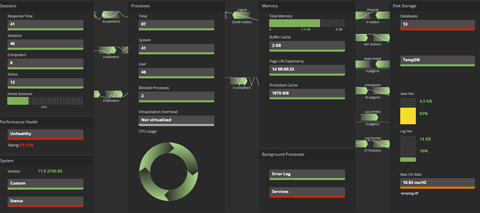
Overview page
A Spotlight overview page captures the performance of a single monitored connection. Flows and components are updated in real time to highlight obvious bottlenecks and problem areas and color coded to indicate when an alarm is raised. See Spotlight overview pages.
Billing and subscriptions
Your organization’s initial subscription to Spotlight Cloud is Trial Professional. ![]()
Your organization’s subscription determines the connection types Spotlight Cloud can monitor and the features you have access to. See compare plans and pricing.
At the end of your organization’s Trial Professional subscription period your subscription will be reduced to Spotlight Cloud Basic. For further options and to manage your Spotlight Cloud subscription see billing and subscriptions.
Configure settings for your Spotlight Cloud organization
A Spotlight Cloud organization was created with your Quest account. The organization allows you and your colleagues to share monitoring data and Spotlight Cloud privileges.
- Learn how to invite people to join your organization.
- Learn how to manage your organization’s account settings.
The Spotlight Cloud Diagnostic Server application is used to configure the Spotlight Cloud Diagnostic Server and monitoring settings for connections on the Spotlight Cloud subscription type of SQL Server. such as for alarms and alarm actions and to add and remove monitored connections. Learn more about the Spotlight Cloud Diagnostic Server application
While evaluating Spotlight Cloud you may have created a temporary Diagnostic Server. On deciding to install Spotlight Cloud in your production environment you may want to copy the configurations created during the evaluation period to the new location. Note that only configuration information is imported. Historical monitoring data is lost on import. See Import Diagnostic Server.