How to open the jobs drilldown for a SQL Server connection
- Direct your web browser to https://app.spotlightcloud.io. Sign in with your Quest account.
- Ensure the Monitoring tab is to the front.
- Select a SQL Server connection type. Select the jobs drilldown.

SQL Server connection types are: SQL Server instance, Azure SQL Managed Instance, Amazon RDS for SQL Server.
SQL agent jobs
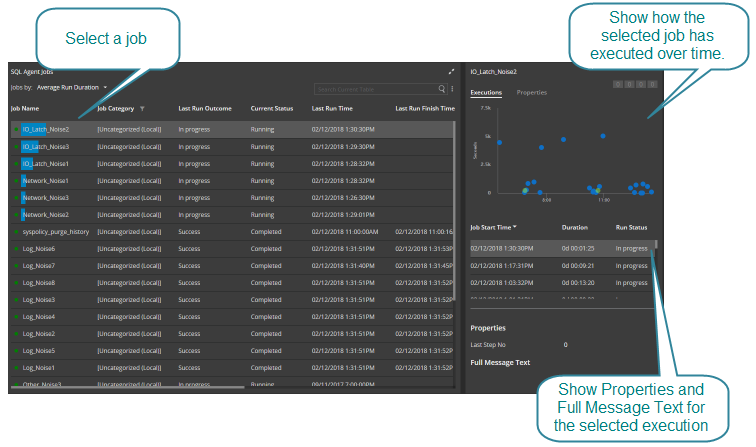
The grid lists all SQL Server agent jobs defined for this server. Select a job to show more data.

Job name
The name of the job.
The colored dot to the left of the job name is an indicator of outstanding alarms related to the job. Green indicates no outstanding alarms. Red indicates at least one high severity outstanding alarm. To investigate these alarms, select the job and then click on the alarms indicator  to open the alarms panel for these raised alarms.
Job category
The SQL agent job category assigned to this job.
Last run outcome
The outcome of the last run (success or fail).
Current status
The current status of the job (running or inactive).
Last run time
The date/time on which the job last ran.
Last run finish time
The time the job finished.
Last run duration
How long the last run took (shown as d hh:mm:ss).
Current run duration
How long the current job has been running for. This column displays information only whilst the job is running.
Average run duration
Average duration of all successful runs for this job.
Session ID
The unique session number for the SQL agent job.
Selected SQL agent job
Alarms indicator
An indicator of the number of alarms of each severity outstanding for the selected job. Click on the alarms indicator to open the alarms panel to investigate these alarms further.
Executions
The chart and table show how the selected job has executed over time, making it easy to determine when it ran, and when it succeeded or failed.
While a job is executing it takes on the color blue. When the job finishes it takes on the color green (success) or red (failure). Hover your mouse over the chart to identify execution start times and duration.
The table underneath identifies job start time, duration and run status. Select a job from this table to see Properties and Full Message Text.
Properties
From the selected SQL agent job panel, click Properties to show the properties tab.
- Job Name
- Job ID
- Job Category
- Enabled - If the job can be run or not.
- Last Run Outcome
- Current Status
- Retries Attempted - Number of retries attempted when the step was last executed
- Last Run Time
- Last Run Finish Time
- Last Run Duration
- Average Run Duration
- Session ID
- %Change