How to open the workload analyzer drilldown
- Direct your web browser to https://app.spotlightcloud.io. Sign in with your Quest account.
- Ensure the Monitoring tab is to the front.
- Select a SQL Server connection type. Select the Workload Analyzer drilldown.
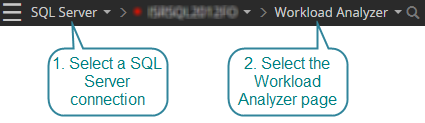
SQL Server connection types are: SQL Server instance, Azure SQL Managed Instance, Amazon RDS for SQL Server.
About the workload analyzer drilldown
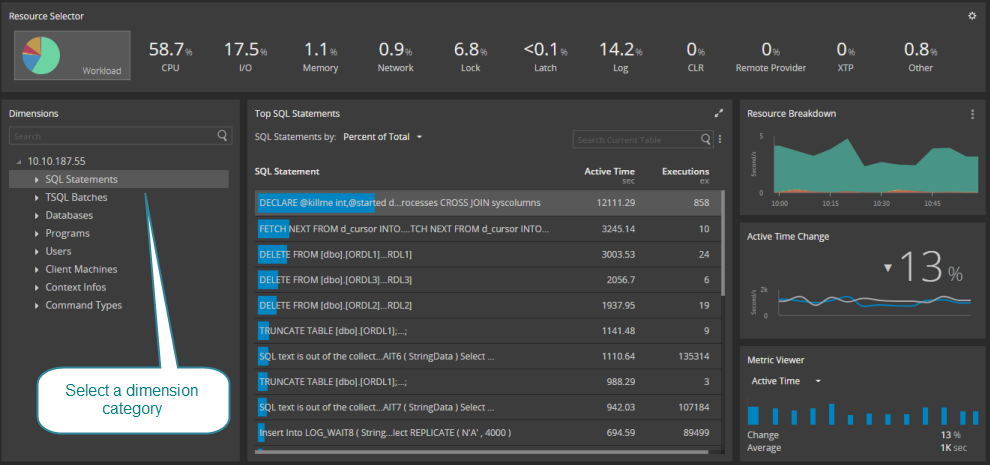
Select a resource and dimension of the SQL Server instance. By default the workload resource is selected. The default dimension selected is the SQL Server instance itself.
The statistics are specific to the selected resource and dimension. The selected dimension may also impact the visual display.
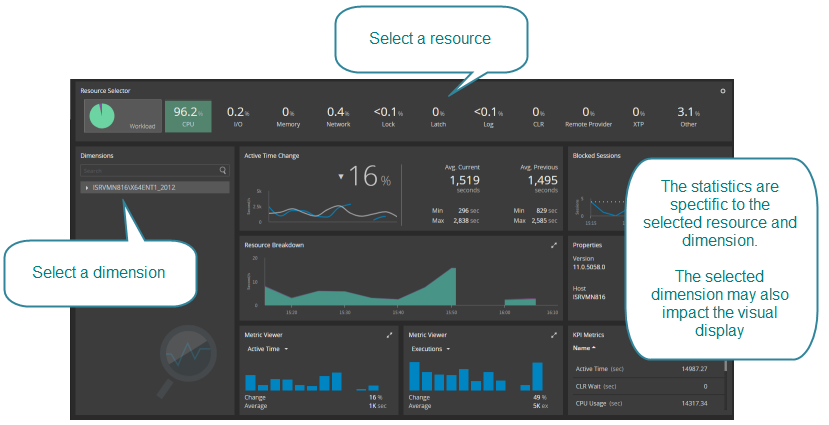
Resource selector
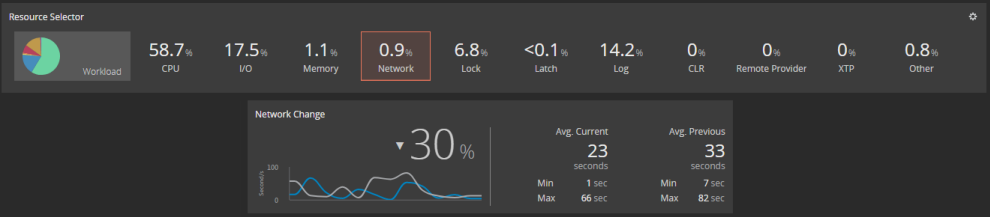
Select a resource currently experiencing workload to drilldown on. (Resources experiencing 0 workload cannot be selected). By default, Workload is selected.

- Workload
- CPU - This resource measures the rate of CPU time needed to parse, compile, and execute each statement in the query. Select this resource to inquire into any strain the SQL Server instance is putting upon the CPU.
- I/O
- Memory
- Network
- Lock
- Latch
- Log
- CLR
- Remote Provider
- XTP
- Other
 Click in the top right corner to configure the Resource Selector panel.
Dimensions
By default the entire SQL Server instance is selected. Optionally, select a dimension of the SQL Server instance to drilldown on.
The dimensions are:
- SQL Statements
- TSQL Batches
- Databases
- Programs
- Users
- Client Machines
- Context Infos
- Command Types
When the SQL Server instance is the selected dimension
Properties
The Properties panel displays properties of the SQL Server instance.
Active time change
The name of the panel changes with the selected resource.
Resource breakdown
Show a breakdown of the use of resources over time. Hover the mouse over the chart to see the legend.
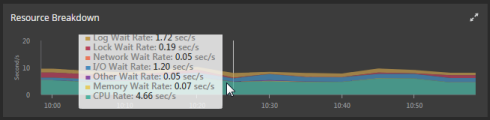
 Click in the top right corner of the panel to show the enlarged Resource Breakdown panel.
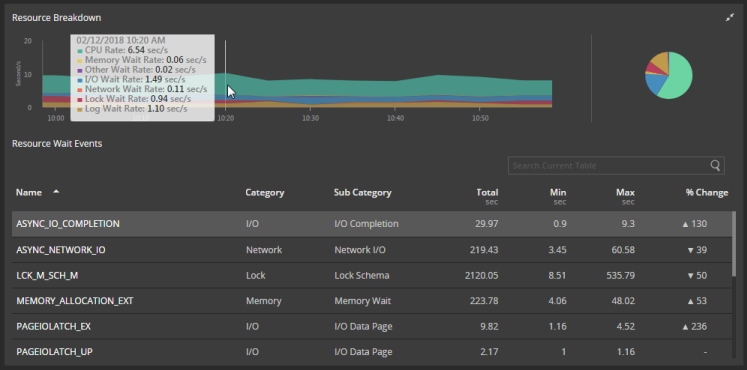
Metric viewers and KPI metrics
For the selected resource and dimension, in the two metric viewer panels, plot any two metrics for each period over time. The KPI metrics panel shows the last period result for each metric.
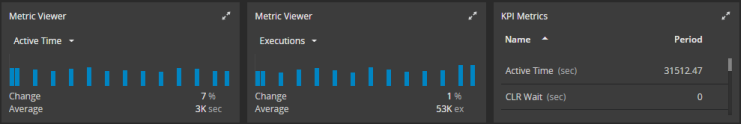
The metrics are as follows:
- Active Time
- Executions
- CPU Usage
- CPU Wait
- I/O Wait
- Latch Wait
- Lock Wait
- Log Wait
- Memory Wait
- Network Wait
- Other Wait
- Remote Provider Wait
- XTP Wait
- CLR Wait
Click in the top right corner of any of the metric panels to show the Key Performance Indicators panel.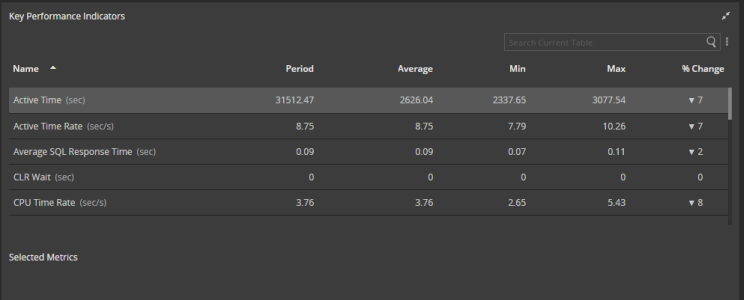
Blocked sessions
A plot of blocked sessions over time for the SQL Server instance.
When a category is the selected dimension
Sort the selected category by:
- Percent of Total
- Active Time
- CPU Wait
- CPU Usage
- I/O Wait
- Memory Wait
- Network Wait
- Lock Wait
- Latch Wait
- Log Write
- CLR Wait
- Remote Provider Wait
- XTP Wait
- Other Wait
- Executions
- Physical Reads
- Logical Reads
- Writes
- Elapsed Time
- Average SQL Response Time
- Granted Memory