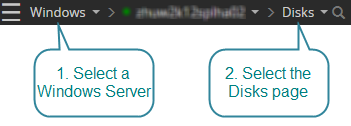
How to open the disks drilldown for a Windows Server connection
- Direct your web browser to https://app.spotlightcloud.io. Sign in with your Quest account.
- Ensure the Monitoring tab is to the front.
- Select a Windows Server connection. Select the disks drilldown.

Instance
Physical disks
Shows the number of physical disks on the Windows Server.
Utilization
Shows the current utilization of the windows Server.
Logical disks
Shows the number of logical disks on the Windows Server.
Logical disks
Grid
Shows summary information on the logical disk(s) on the system. Select a disk for more specific information in the Space usage panel.
Drive
Shows the name of the disk drive.
Transfer Time
Shows the average time (in milliseconds) that I/O operations are taking.
Disks I/O
Shows the total number of write and read operations per second against the disk
Space usage
This gives a graphical view of usage and available space on the selected logical drive.
Transfer time
This shows the average time it is taking for data to be transferred between disk and memory, and includes both disk reads and disk writes. If disk transfers are taking consistently longer than 50 milliseconds, a disk bottleneck may be developing.
Queue length
This shows the number of I/O requests that were queued for the selected logical disk. Disk queue length indicates how heavily loaded a disk subsystem is. High queue lengths mean the disks are struggling to process the I/O load being put on them.
Physical disks
Grid
Shows summary information on each physical hard disk on the system. Select a disk for more specific information in the Summary / Properties panel.
Summary
Transfer time
This shows how long it is taking for data to be transferred between disk and memory, and includes both Disk Reads and Disk Writes. If disk transfers are taking consistently longer than 50 milliseconds, a disk bottleneck may be developing.
Queue length
This shows the number of I/O requests that were queued for the selected physical disk. Disk queue length indicates how heavily loaded a disk subsystem is. High queue lengths mean the disks are struggling to process the I/O load being put on them.
Properties
Disk
This shows the physical disk number as used by Windows to distinguish between separate physical disks on a single controller.
Description
A description of each disk discovered. This displays RAID details where applicable.
Type
This will inform if the disk is SCSI or IDE.
Total GB
Shows the capacity of the disk.
Device type
Shows the device properties for the disk.
Hardware vendor
Shows information reported from the disk and driver. In RAID configurations, the RAID level of a physical disk array is often stated here.
Partitions
Shows the number of partitions on the disk.
Top consumers
Shows information on the processes that are top consumers of system disks.