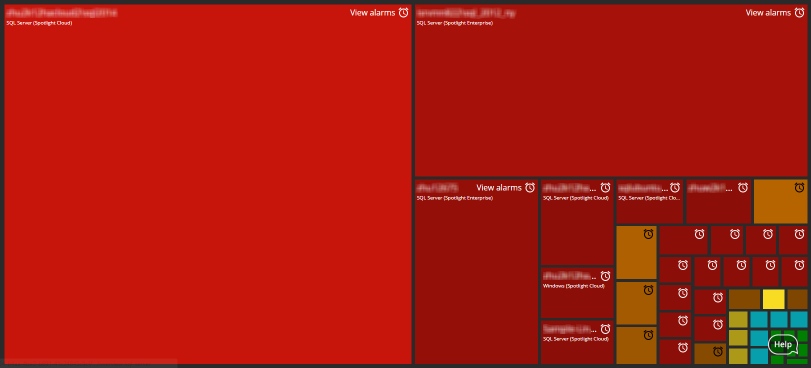
Connections are organized on the surface area of the heatmap according to the number and severity of alarms raised against them. Connections with the most alarms raised against them of the highest severity are given the most surface area on the heatmap.
How to open the heatmap
The heatmap is the opening page on the Spotlight Cloud monitoring tab. Sign in to https://app.spotlightcloud.io to see the Monitoring tab.
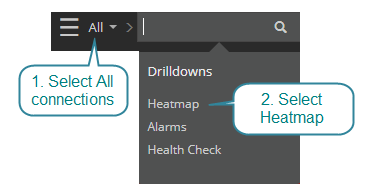
Following sign in you can always return to the Heatmap from the navigation menu top left of the monitoring screen. Select All from the list of available connections; select Heatmap from the list of available displays for All connections.
Color and alarm severity
Connections are colored according to the most severe current alarm.
| Color | Severity | Description |
|---|---|---|
| High | At least one high severity alarm is raised against this connection. | |
| Medium | At least one medium severity alarm is raised against this connection. No high severity alarms are raised. | |
| Low | At least one low severity alarm is raised against this connection. No high or medium severity alarms are raised. | |
| Information | At least one information alarm is raised against this connection. No other alarms are raised. | |
| Normal | No alarms are raised against this connection. |
Connections in planned outage are automatically removed from the Heatmap.
Drilldown on a connection
Click on a connection on the surface area of the heatmap to open the Spotlight overview page for the connection.
Inquire into raised alarms
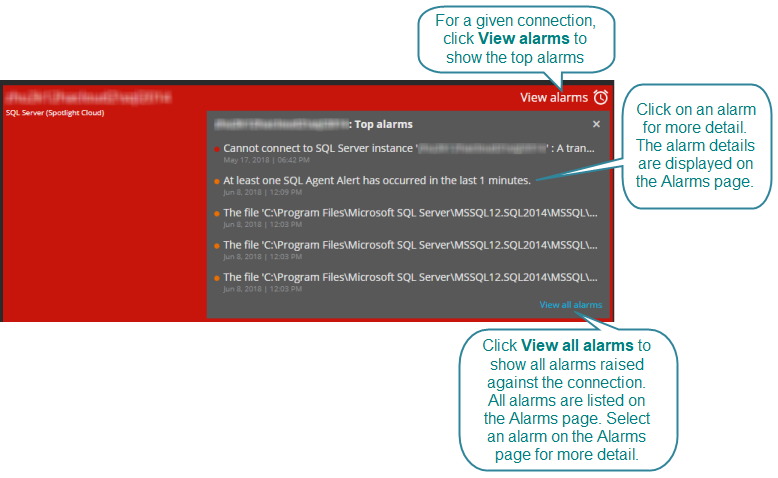
For a given connection, click View alarms (top right corner of the heatmap surface). This will show the top alarms raised against the connection. Click on one of these alarms to open the alarm on the alarms page. Click View all alarms to show all alarms raised against the connection on the alarms page. You can sort and filter alarms on the alarms page and select an alarm for more detail.
You can see all alarms raised against all connections on the Heatmap without leaving the Heatmap via the alarms panel. From the top right corner of the heatmap page, click  to open the alarms panel.