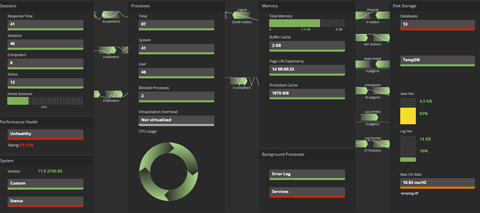
Spotlight overview page for SQL Server instance
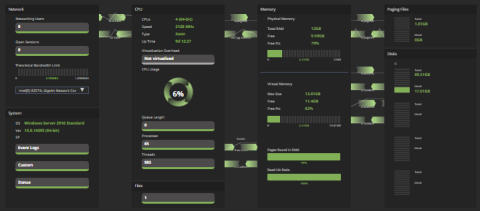
Spotlight overview page for Windows
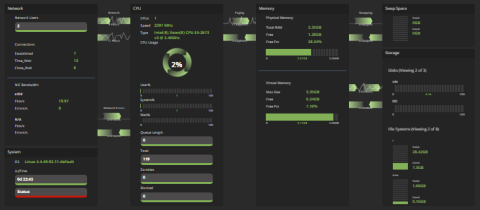
Spotlight overview page for Unix
How to open a Spotlight overview page
Sign in to https://app.spotlightcloud.io to see the Monitoring tab. Select a connection from the menu top left of the monitoring page. When a single connection is selected the initial monitoring page is the Spotlight overview page.
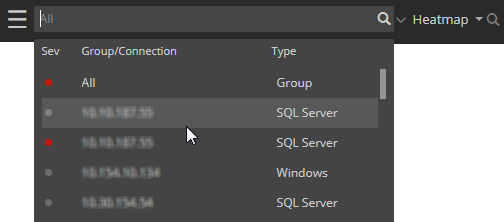
From the heatmap, click on a connection to open the Spotlight overview page for that connection.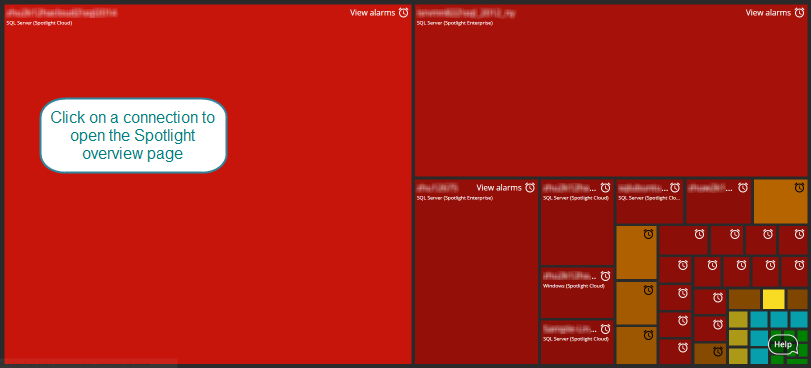
Spotlight overview page flows and components
A Spotlight overview page is made up of flows and components tailored to the connection type. Hover your mouse over a flow or component for more detail. You will see up to 4 icon links (alarms, trends, diagnose and description). Some flows / components do not show all 4 links.
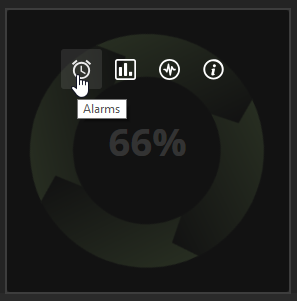
Alarms
If the color of a component is other than green then the component is in an alarm state. If more than one alarm is raised against a component then the color shows the highest severity alarm raised.
| Color | Severity | Description |
|---|---|---|
| High | At least one high severity alarm is raised against this component. | |
| Medium | At least one medium severity alarm is raised against this component. No high severity alarms are raised. | |
| Low | At least one low severity alarm is raised against this component. No high or medium severity alarms are raised. | |
| Information | At least one information alarm is raised against this component. No other alarms are raised. | |
| Normal | No alarms are raised against this component. | |
| Disabled | Spotlight Cloud is not monitoring this component. During a planned outage all Spotlight overview page controls are disabled except Status. |
Drilldown on alarms raised against a component
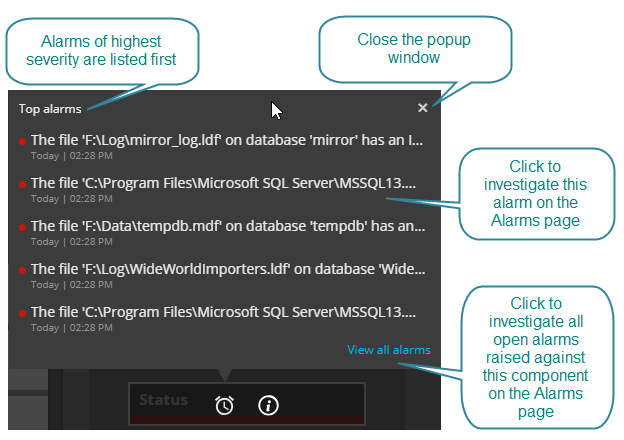
Hover the mouse over the component. Click the Alarms icon link. A popup window shows the top alarms raised against the component. If no alarms are raised the popup window says, “No alarms raised”. If there is no Alarms icon link then no alarms are associated with this component.
The popup window shows the top 5 alarms raised against the component. Alarms of the highest severity are listed first; alarms of the same severity are listed in descending order of time raised. Click on an alarm to open that alarm in the alarms page. Click View all alarms to show all alarms raised against the component in the alarms page.
For a quick way to see alarms raised against the connection, click  to open the alarms panel.
Trends
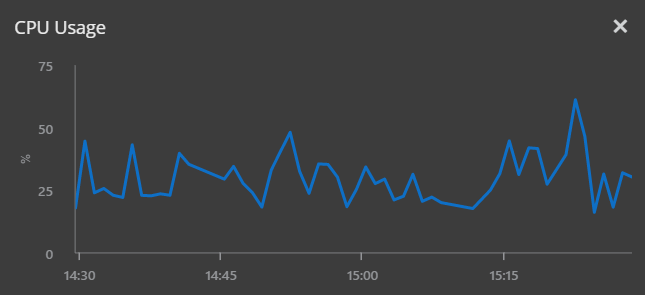
Requires Spotlight Cloud ProfessionalHover the mouse over the component. If the component has a Trends link then a trends or time series chart is available for the data collected.
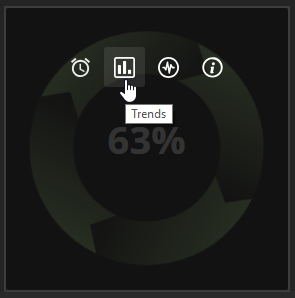
Click on the trends link to show the chart.
Diagnose
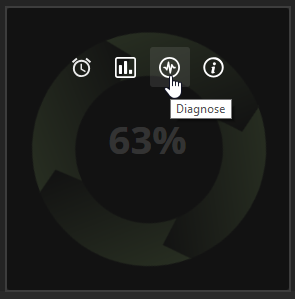
Hover the mouse over the component. If the component has a Diagnose link then there are one or more drilldown pages that show further detailed analysis of the data. Click on the diagnose link to list the drilldown pages. Click on a drilldown page to open it.
Description
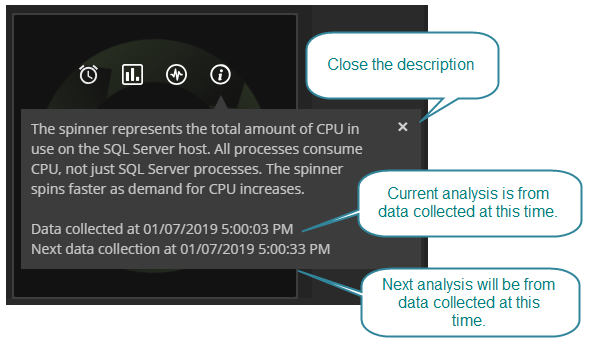
Hover the mouse over the component. Click on the Description link for more information on the component.
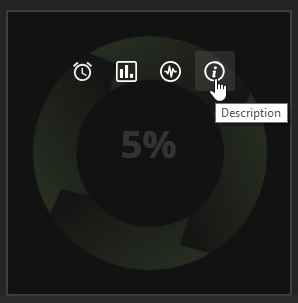
In addition to descriptive information the description link lets you know when the data was last collected for this component and when data will next be collected for this component.
Time period controls
Requires Spotlight Cloud ProfessionalTime period controls are near the top right corner of the Spotlight overview page.
 .
.
For general information on the time period controls see time period or playback
On the Spotlight overview page the most recent collected data value for components is shown, that is the value collected closest to the end of the time period. To see when that data value was collected hover the mouse over the component and click on the Description link.
The flows between the components show a 15 minutes trend aggregated over the final 15 minutes of the time period.
The following information applies to the alarms, trends, diagnose and description links when you hover your mouse over a component or flow in a historical time period.
| Link | Description |
|---|---|
| Alarms | Show alarms raised on the component open at the end of the time period. |
| Trends | The plotted time spans the entire selected time period (from the start time to the end time). |
| Diagnose | If you click to open a drilldown page it will open in the same selected time period as the Spotlight overview page. |
| Description | The description shows the time the data was collected for this component. This will be the last collection time in the selected time period. |
How to configure the virtualization overhead component
The SQL Server instance and Windows Server overview pages have a virtualization overhead component.
If the Windows Server or SQL Server host is hosted on VMware then the virtualization overhead component takes the form of a gauge. It shows the percentage of CPU that is unavailable to this virtual machine because it is being consumed either by other virtual machines or by VMware itself.
If the Windows Server or SQL Server host is hosted on Hyper-V then the component shows wait time in nanoseconds. This shows the average time the virtual machine spent waiting for CPU over the collection interval (average 5 minutes). The average queue time should remain under 60,000ns. If the average queue time exceeds 60,000ns then a Hyper-V CPU wait time per dispatch alarm is raised. A high alarm is raised if the average queue time exceeds 100,000ns.
If the virtualization overhead component says Not Virtualized then either the Windows Server is not hosted on a virtual machine or the virtual machine is unknown to Spotlight Cloud. Use the Spotlight Cloud Diagnostic Server application to update Windows Server connection details.