Information is displayed in the form of bar charts, time series charts, simple data values and descriptive text.

How to open a drilldown page
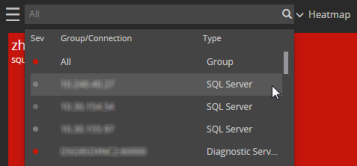
Sign in to https://app.spotlightcloud.io to see the Monitoring tab. From the navigation menu top left of the monitoring screen, select a connection.

When a single connection is selected the initial monitoring page is the Spotlight overview page.

Other drilldown pages are available dependent on the type of connection selected. For example, the TempDB Usage drilldown is relevant to SQL Server connections only. Click on the current page type (say Overview). From the menu that opens, select from the available drilldowns.
Drilldown pages specific to the connection type
For more information on the drilldown pages available, refer to the connection type:
Panels and views
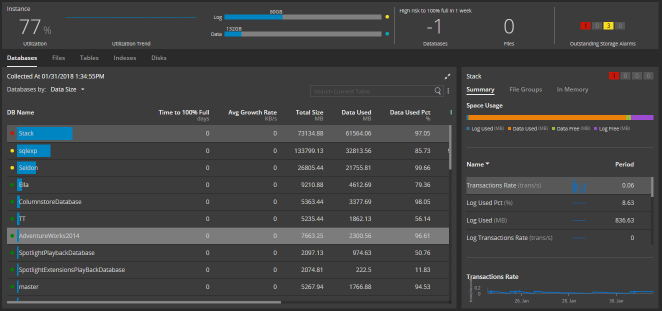
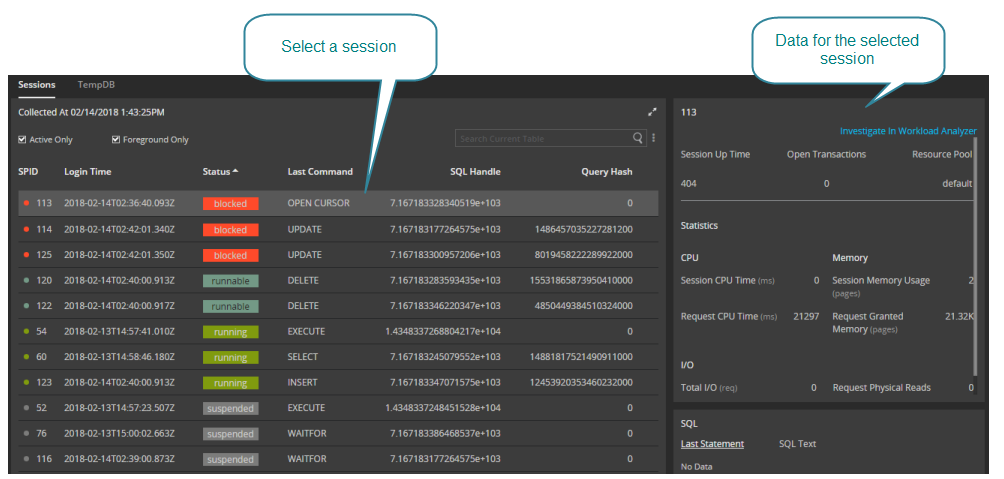
The drilldown is made up of one or more panels. Those panels may be related. On the screenshot, selecting an item in the left panel shows data specific to that item on the right panel.

Charts and tables
Learn about Spotlight Cloud charts and tables. Learn how to show a chart legend and data values. Learn how to sort tables and search for table text. See Charts and Tables
Maximize screen real estate
Panels with a  in the top right corner can be enlarged / reduced to take up more or less screen real estate. Often further analysis is available when the panel is maximized.
Outstanding alarms display
The outstanding alarms display is of the following format.  Learn more about the outstanding alarms display and how you can use it in your analysis at outstanding alarms display.
Time period controls
Requires Spotlight Cloud ProfessionalTime period controls are near the top right corner of all monitoring pages except the heatmap and SQL Server health checks.
 .
.
Learn how to select a historical time period. Use playback to step back in time by fixed intervals.
Use historical alarms to explore the state of your monitored connections when a given alarm was raised. Use the alarms page to list alarms open at the end of a historical time period across multiple connections, categories and sub categories of alarms. Use the Spotlight overview page to investigate (drilldown on) a monitored connection and an alarm raised against that connection.
The selected time period will stick for the monitored connection as you explore different drilldown pages. When you select a different Spotlight connection to monitor or click Reset then Spotlight Cloud will return to real time monitoring.