Monitoring pages
Monitoring pages are available from the Monitoring tab on sign in to https://app.spotlightcloud.io.
| Screen | Description |
|---|---|
| Heatmap page | The heatmap answers the question: Which monitored connections require the most urgent attention? |
| Alarms page | Use the alarms page to comprehensively inquire into all outstanding alarms. |
| Health check page | Use the health check page to pinpoint and address key system health issues within your SQL Server infrastructure. |
| Spotlight overview pages | Spotlight overview pages capture the performance of a single monitored connection. |
| Drilldown pages | Drilldown pages capture the performance of an aspect of a single monitored connection. |
How to switch between monitoring pages
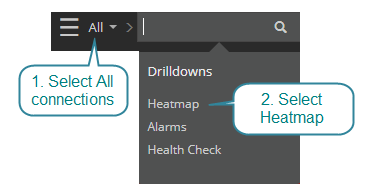
The heatmap is the opening page on the Monitoring tab. You can navigate to any page on the monitoring tab from the navigation menu top left of the screen. Select All from the list of available connections to show pages involving multiple connections like the Heatmap. Select a single connection to show pages specific to that connection like the Overview page and drilldown pages. See also navigate pages and connections.
Charts, grids, panes and panels
| Feature | Description |
|---|---|
| Alarms panel | Use the alarms panel to inquire into outstanding alarms on the current monitoring page. |
| Outstanding alarms | The outstanding alarms display is common to many drilldown pages. It answers the question - how many alarms of each severity are raised against this drilldown page or drilldown pane? |
| Charts and tables | Spotlight Cloud charts and tables, features, tips and tricks. |
Color
The alarm, connection or connection view is colored according to the most severe current alarm.
| Color | Severity | Description |
|---|---|---|
| Normal | No alarms are raised against this connection. | |
| Information | At least one information alarm is raised against this connection. No other alarms are raised. | |
| Low | At least one low severity alarm is raised against this connection. No high or medium severity alarms are raised. | |
| Medium | At least one medium severity alarm is raised against this connection. No high severity alarms are raised. | |
| High | At least one high severity alarm is raised against this connection. | |
| Urgent | The Diagnostic Server has stopped uploading monitoring data to Spotlight Cloud. As a consequence, all connections monitored through this Diagnostic Server cannot be reached. |
Historical data
Requires Spotlight Cloud ProfessionalTime period controls are near the top right corner of all monitoring pages except the heatmap and SQL Server health checks.
 .
.
| Feature | Description |
|---|---|
| Time Period | Select a historical time period to investigate. Click Reset to return to real time monitoring. |
| Playback | Step back in time by fixed intervals. Step forward or click Reset to return to real time monitoring. |
To investigate historical alarms, use the alarms page to list alarms across multiple connections, categories and sub categories. Use the Spotlight overview page to investigate a component of a monitored connection in an alarm state.
What if I don’t see any of my monitored connections on the page
Check: Have you set up Spotlight Cloud in your organization or accepted an invitation to join an organization?